

EJ Analyzer
Turn ATM journal logs into answers.
EJ Analyzer processes Electronic Journal logs from across your ATM network and gateways, so operations and investigation teams can see activity, spot anomalies and find recurring problems without digging through raw files.

What is EJ Analyzer?
Every ATM writes an Electronic Journal (EJ), a detailed log of what happened on the machine. Across a network and several gateways, those logs add up to a huge volume of text that is hard to search and harder to interpret.
EJ Analyzer processes those logs and presents a clear, network-wide view of transaction activity. It helps teams monitor what is happening, identify anomalies and recurring issues, look back through historical logs and produce operational reports.
The goal is simple: faster troubleshooting, better-informed investigations and fewer surprises.
The problems it solves
Raw journal logs are rich in detail but hard to use at network scale.
Logs spread across gateways
Each gateway produces its own journals, so there is no single place to see network-wide activity.
Slow troubleshooting
Finding the cause of a fault means searching large text files by hand.
Recurring issues stay hidden
The same fault on different machines or days is hard to spot without aggregation.
Investigations lack context
Reconstructing what happened around a transaction takes time and specialist knowledge.
What it does
From raw logs to insight, across every gateway.
ATM Electronic Journal log processing
Ingest and interpret EJ logs so raw text becomes structured, searchable information.
Multi-gateway log analysis
Bring logs from multiple gateways together into one consolidated, network-wide view.
Transaction activity monitoring
See transaction activity across the ATM estate and how it changes over time.
Anomaly identification
Surface unusual events and patterns that deserve a closer look.
Recurring issue detection
Identify problems that keep happening across machines, gateways or time periods.
Historical log analysis
Look back through past logs to understand trends and investigate earlier events.
Operational reporting
Produce reports that operations and management teams can act on.
Faster investigations
Give investigators the context they need without manual log searching.
Why it matters
A network-wide view
See the whole ATM estate at once instead of one gateway or machine at a time.
Faster troubleshooting
Move from 'something is wrong' to 'here is where and why' more quickly.
Better investigations
Reconstruct events with context drawn from structured historical data.
Fewer repeat problems
Detect recurring issues so root causes can be addressed, not just symptoms.
How it is put together
Logs from each gateway are ingested and normalised into a single analytical view, which powers monitoring, investigation and reporting.
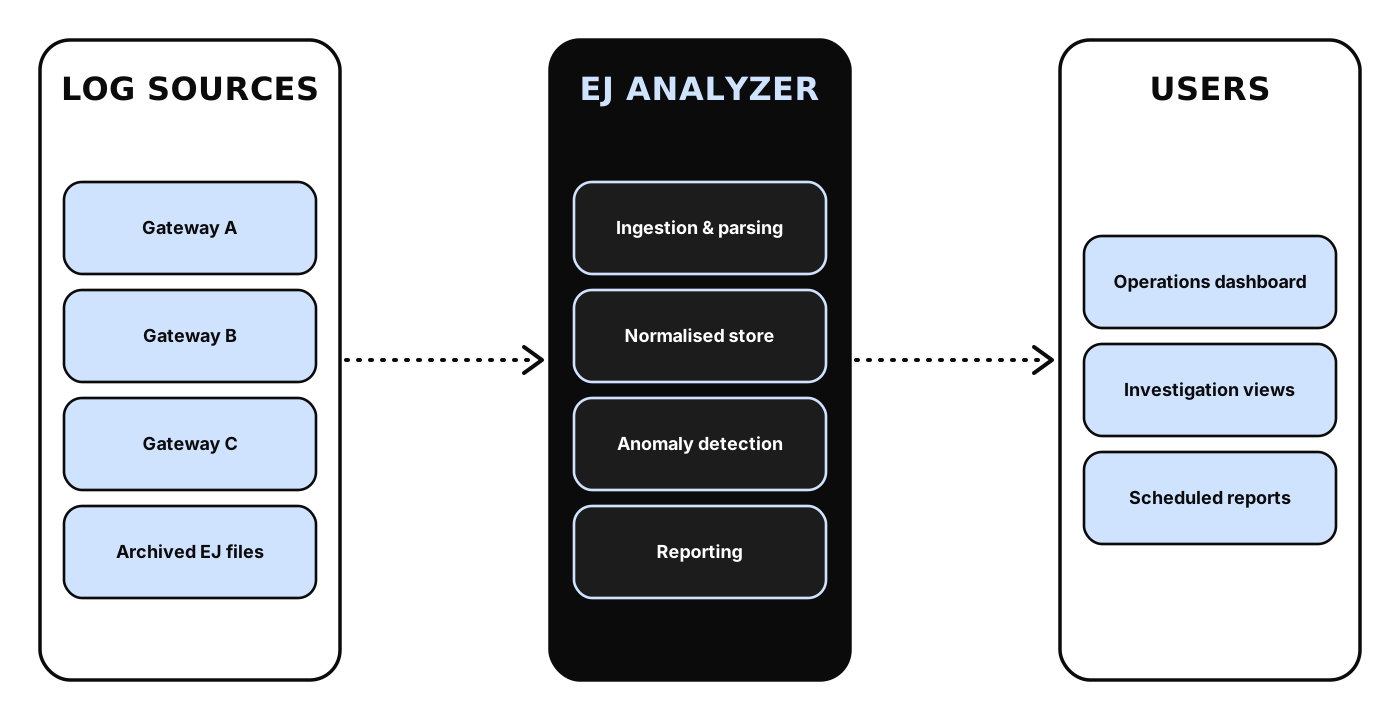
Log sources
Electronic Journal logs produced across your gateways and ATMs.
Ingestion and parsing
Reads the logs and converts raw entries into structured events.
Analysis
Applies analysis across the combined data set.
Views and reporting
Presents results to operations and investigation teams.
How it works, step by step
How a journal entry becomes an insight.
Collect logs
Journals from your gateways and ATMs are provided to the platform.
Process and normalise
Entries are parsed and combined into a consistent, searchable view.
Monitor activity
Operations teams watch transaction activity across the network.
Identify anomalies and patterns
Unusual events and recurring issues are highlighted for attention.
Investigate and report
Drill into events, look back historically and share findings.
Where it fits
ATM network operations
Monitor activity and keep the estate healthy from a single view.
Fault investigation
Trace the sequence of events around a failure or customer dispute.
Recurring problem analysis
Find faults that repeat across machines, gateways or time periods.
Management reporting
Give operations leaders clear reports on ATM activity and issues.
See the experience
Illustrative interface mock-ups that show the kind of views and workflows the product provides.
Built to fit your environment
Transaction logs are sensitive operational data. EJ Analyzer is designed for controlled access and traceable use.
Controlled access
Restrict transaction log analysis to authorised operations and investigation staff.
Traceable use
Keep a record of who accessed and reported on the data.
Secure handling of logs
Designed so sensitive operational data is handled within your approved environment.
Multiple gateways
Combine logs from several gateways into one view.
Archived and historical logs
Include historical logs for trend analysis and investigations.
Reports you can share
Operational reports in formats agreed during implementation.
| Focus | Analysis of ATM Electronic Journal (EJ) logs across multiple gateways |
|---|
| Core capabilities | Log processing, transaction monitoring, anomaly and recurring issue detection, historical analysis, reporting |
|---|---|
| Access model | Role-based access, configured per organisation |
| Log sources and formats | Confirmed during discovery for your gateways and ATM estate |
|---|---|
| Implementation | Configured and deployed per engagement |
Questions we hear most
What is an Electronic Journal (EJ)?
Can it handle several gateways?
What kinds of problems does it help find?
Can we analyse historical logs?
Can we see a demonstration?
Often used together


See EJ Analyzer in your context
Tell us about your environment and we'll show you how EJ Analyzer would fit, or talk through the options with an engineer.
Descriptions on this page are conceptual. Exact deployment options, integrations and specifications are confirmed with you during discovery.